THE Greek government has been advised by British economists to leave the euro and default on its €300 billion (£255 billion) debt to save its economy.
The Centre for Economics and Business Research (CEBR), a London-based consultancy, has warned Greek ministers they will be unable to escape their debt trap without devaluing their own currency to boost exports. The only way this can happen is if Greece returns to its own currency.
Greek politicians have played down the prospect of abandoning the euro, which could lead to the break-up of the single currency.
Speaking from Athens yesterday, Doug McWilliams, chief executive of the CEBR, said: “Leaving the euro would mean the new currency will fall by a minimum of 15%. But as the national debt is valued in euros, this would raise the debt from its current level of 120% of GDP to 140% overnight.
“So part of the package of leaving the euro must be to convert the debt into the new domestic currency unilaterally.”
Greece’s departure from the euro would prove disastrous for German and French banks, to which it owes billions of euros.
McWilliams called the move “virtually inevitable” and said other members may follow.
“The only question is the timing,” he said. “The other issue is the extent of contagion. Spain would probably be forced to follow suit, and probably Portugal and Italy, though the Italian debt position is less serious.
“Could this be the last weekend of the single currency? Quite possibly, yes.”
As of today the idea that Greece might be better off leaving the Euro and renegotiating its debt is considered by many to be unthinkable. Instead, the country is embarking upon a program of “internal devaluation” – in which it keeps the Euro and lowers its real exchange rate by creating enough unemployment to drive down the country’s wages and prices.Let’s compare this process to two other countries that have tried it – one which abandoned it after three and a half years – Argentina – and one that is continuing it – Latvia.First, Greece: Figure 1 shows the IMF’s April 2010 projections for real (inflation-adjusted) GDP. Note that in 2015, Greece still does not reach its pre-crisis (2008) level of GDP. However, these projections are already out of date; the current projections from the Greek Finance Ministry show a 4 percent decline for 2010, whereas the IMF’s projections had only shown a 2 percent drop. Moreover, it will most likely be worse; when Latvia began its “internal devaluation” in 2008, the IMF projected a 5 percent drop in GDP for 2009; it came in at more than 18 percent. Result: Greece will probably need at least 8 or 9 years, if things go well under the current program, to reach pre-crisis output.FIGURE 1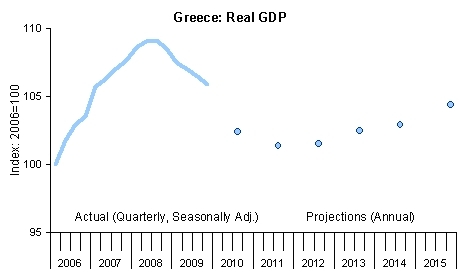 Second, Latvia: As can be seen in Figure 2, Latvia – which set a world-historic record in 2008-2009 by losing more than 25 percent of GDP – is not expected to reach even its 2006 level of GDP in 2015. And in 2015, it is still 16 percent below its pre-crisis peak in 2007. Result: well over a decade to return to pre-crisis GDP, barring unforeseen negative events.FIGURE 2
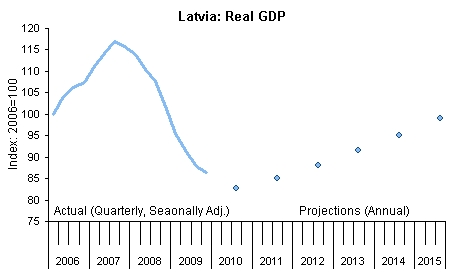 Sources for Figures 1 and 2: IMF International Financial Statistics and World Economic Outlook.Third, Argentina: Figure 3 shows Argentina’s recession beginning in the middle of 1998. Argentina tried the “internal devaluation” process – its currency was pegged at 1 to 1 to the dollar -- until the end of 2001, leading to an economic and financial collapse. In December 2001-January 2002, the government defaulted on its debt and abandoned the fixed exchange rate. Result: after the default/devaluation, the economy continued to shrink for just one quarter (first quarter 2002). It then grew and passed up its pre-crisis peak within three years of the default and devaluation, with real (inflation-adjusted) growth of 63 percent over 6 years.FIGURE 3
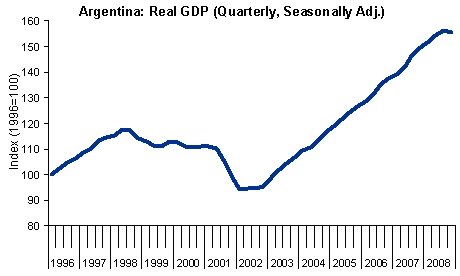 Source: Instituto Nacional de Estadística y Censos, República Argentina.Conclusion: before making a commitment to indefinite recession and slow recovery, including many years of high unemployment and other social costs, Greece may want to consider the alternatives. They may be less painful and allow for a speedier, more robust economic recovery.
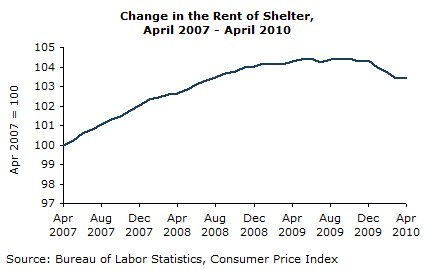 Falling rents also continue to hold down core inflation. Rent of primary residence was essentially unchanged in April and despite a 0.1 percent increase in March, has remained flat over the last six months. Owners’ equivalent rent (OER) of primary residences—which accounts for nearly four times as much of the CPI—fell less than 0.1 percent in April. This was the sixth consecutive month of small decline in OER, and over that time it has fallen at a 0.7 percent annualized rate. Falling energy prices helped push down transportation prices, which fell 0.5 percent in April. Transportation prices have fallen at a 2.8 percent annualized rate over the last three months, after rising at a 14.2 percent rate over the previous three. The previously-reported disinflation in the used-car market continued in April as prices rose only 0.2 percent in the month. The cash-for-clunkers program drove the three-month rate of inflation in the price of used cars to an annualized rate of over 30 percent for the quarter ending in October, but has declined steadily since then. Used car prices have risen at a 5.6 percent rate since January. Apparel prices fell again in April. Though apparel accounts for less than 4 percent of the overall CPI, prices have fallen at a 7.0 percent annualized rate over the last three months and 3.4 percent over the last six. Elsewhere in the core index, medical care continues to be a source of price pressure—rising 0.2 percent in the month. Among medical care costs, hospital and related services were again the fastest growing in April, though not as fast as the previous two months. The price of hospital services rose 0.4 percent in the month—a 4.3 percent annualized rate of growth. By contrast, those prices rose 1.1 and 1.0 percent in February and March, respectively. Education prices rose another 0.5 percent in April. Tuition, fees, and child-care prices have seen a 1.7 percent increase in the last three months—a 7.0 percent annualized rate of growth. Tuition prices have averaged 5.9 percent annual inflation over the last ten years—more than twice as fast as the 2.4 percent inflation overall. Non-agricultural export prices rose 1.4 percent in April, and have risen 6.0 percent over the last year. At the same time, nonfuel import prices rose 0.5 percent. The rise in both import and export prices has been concentrated in industrial supplies rather than consumer or capital goods. The producer price indices largely tell the same story, as the price of core finished goods have risen at a 1.4 percent annualized rate over the last three months. Non-food, non-energy crude prices have risen at a 43 percent rate over the last year, but this is in large part a recovery from the rapid fall in the second half of 2008. Over the last three years, prices have risen at a 5.1 percent annualized rate. Intermediate core goods show the same pattern. Despite a sharp run-up and fall in 2008, and a current three-month rate of inflation over 11 percent, intermediate prices have risen a cumulative 8.2 percent over the last three years. Overall, the inflation picture is not much changed since last month. The pressures at earlier stages of production are confined to supplies and materials, which have experienced large price booms and busts over the last few years, but producers have largely not passed these price changes on to consumers. As a result, deflation is present in much of the core index and energy prices have begun to fall once again—leaving little threat of inflation.