Calculated Risk with a summary of last week's economic data:
-
NAHB Builder Confidence declined sharply in June
 Click on graph for larger image in new window.This graph shows the builder confidence index from the National Association of Home Builders (NAHB).The housing market index (HMI) was at 17 in June. This was a sharp decline from 22 in May.Note: any number under 50 indicates that more builders view sales conditions as poor than good.
 - Housing Starts plummeted in May
 Total housing starts were at 593 thousand (SAAR) in May, down 10% from the revised April rate of 659,000 (revised down from 672 thousand), and up 24% from the all time record low in April 2009 of 477 thousand (the lowest level since the Census Bureau began tracking housing starts in 1959). Single-family starts collapsed 17.2% to 468,000 in May. This is 30% above the record low in January 2009 (360 thousand).This was way below expectations (I took the under!), and is good news for the housing market longer term (there are too many housing units already), but bad news for the economy and employment short term.
 - Industrial Production, Capacity Utilization increased in May From the Fed: Industrial production and Capacity Utilization
 This graph shows Capacity Utilization. This series is up 9.4% from the record low set in June 2009 (the series starts in 1967). Capacity utilization at 73.7% is still far below normal - and 7.2% below the the pre-recession levels of 80.5% in November 2007.Note: y-axis doesn't start at zero to better show the change.
 - Philly Fed Index "decreased notably" in June Here is the Philadelphia Fed Index released this week: Business Outlook Survey.
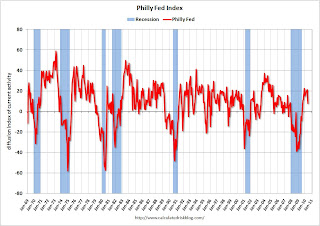 This graph shows the Philly index for the last 40 years.The index has been positive for ten months now, but turned down "notably" in June.This might suggest that growth in the manufacturing sector is slowing. Especially concerning is the slightly negative employment index.
Lumber Prices off 30% since April
From the NAHB, framing lumber prices have collapsed since the end of April.
This graph shows two measures of lumber prices: 1) from Random Lengths (via NAHB), and 2) CME futures.With so many mills shut down during the bust, the supply of lumber was way down - and prices surged early this year with a slight increase in construction activity. Now that construction has slowed - at the same time mills were coming back online (more supply) - prices have collapsed.
No comments:
Post a Comment